With all the buzzwords, lingo, tools and metrics out there, making sense of the digital landscape can be challenging and confusing for the owner or manager of a healthcare practice. On top of that, quantifying the value and impact on bottom line revenue for digital marketing services like “SEO” or “PPC” can be just as difficult.
If you find yourself in this situation or are having trouble measuring what these services are truly worth in terms of revenue growth, then you will find this article very helpful. Together, we are going to breakdown in detail how to measure the value of a #1 ranking in Google in terms of monthly and annual gross revenue. For this example, we are going to focus on variations of “orthopedic doctors and surgeons in NJ” as the main keywords.
It All Begins With Your Keywords
Keywords are the starting point of a search engine optimization campaign. Whether it is knee replacement, spine surgery or finding an orthopedic doctor in the local area, these are the exact words and phrases that your patients are using when searching for a solution to their problem. When thinking about keywords, it’s more important to think about the intention behind the words rather than the words themselves. This perspective helps to develop a deeper understanding of what the person behind the screen is really looking for.
Step 1: Determine Keyword Search Volume
Every individual keyword phrase has a unique number of searches per month, based on the demand, specificity, and content of that search term. For example, broader keywords, such as “surgeon”, will have a higher search volume than specific keywords/keyword phrases, such as “orthopedic surgeon in Princeton, New Jersey”.
Below are a list of keywords we will use in our estimation of revenue from a #1 ranking in Google…
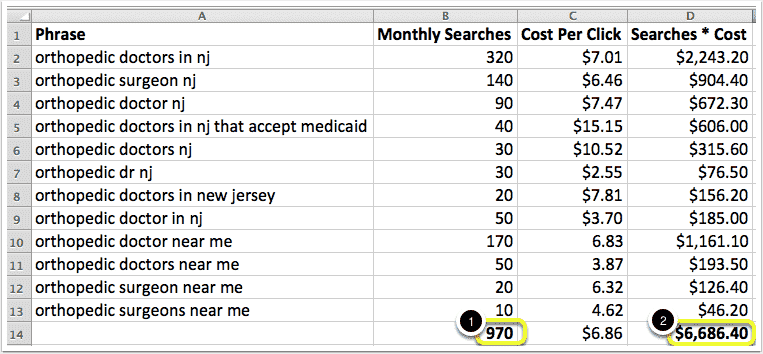
In the left column, you will see the list of words. Although these keywords aren’t exactly the same, they are variations of the same intention, which is an orthopedic doctor or surgeon in the target area (which is NJ in this example).
The Monthly Searches column is a list of the search volume for each of these keywords, which is pulled directly from Google’s search database. At the bottom of this column (1) is the total number of searches available for all keywords, which is 970. This is the first number we need for our measurement.
Also, make a note of the cell marked #2. This number, $6,686.40 is the amount it would cost to buy all of this traffic from Google per month. Keep that in the back of your mind as we continue.
Step 2: Organic Click Through Rate
The metric we’re including in our revenue prediction analysis is Click Through Rate, which I will refer to as CTR. CTR is the ratio of how many people click a website listing in Google divided by the total number of searches. So to make it simple, if 100 people search for a term and 50 people click a particular website listing, the CTR for that listing is 50%.
Now here’s where things get really exciting or disheartening (depending on your website presence)… A study performed by AdvancedWebRanking in 2014 analyzed a total of 465,020 keywords across 5,176 websites using Google Webmaster Tools to accurately measure the CTR based on the ranking position of a website.
The study excluded keywords where the data might be skewed wildly in one direction, such as brand-related search terms. The reason for this exclusion is because brand-related terms have a very high CTR. That is because a critical analysis of the search results before a decision to click is made is not needed. Instead, users search a brand name (such as Apple Computers) and click their official website, resulting in an above average CTR.
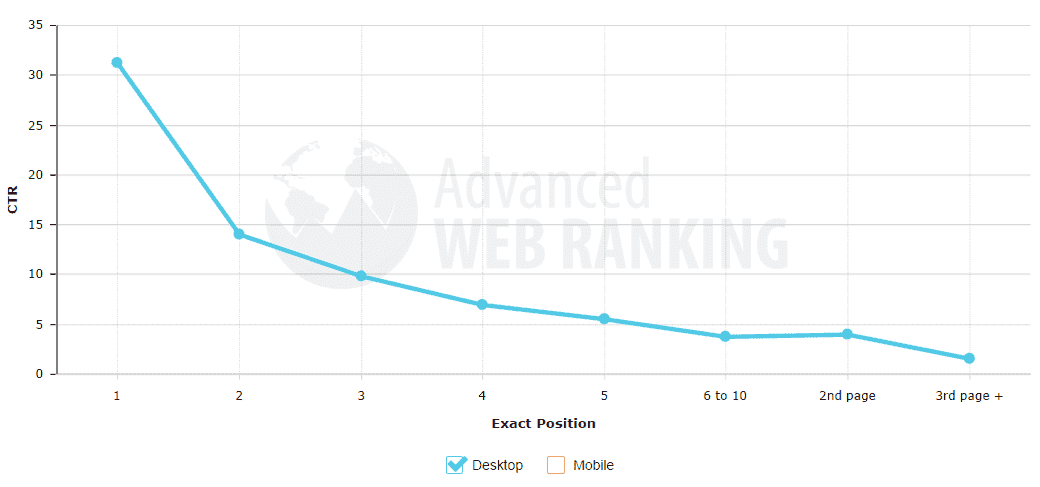
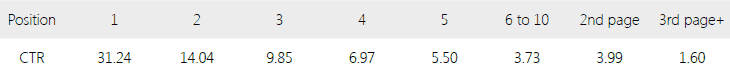
The graph above shows that the #1 ranking position gets 31.24% of search traffic on average. That means nearly one out of every three searches performed click the website in the #1 position.
The #2 position drops to less than HALF of the #1 result, getting about 14%. Position #3 drops to 9% and position #4, 5 and 6-10 drop respectively to a measly 6.9%, 5.5%, and 3.73%.
Ready for the really bad news?
The second page barely grabs 4% of the search traffic, meaning that if you aren’t on page 1, you are likely to never be found by patients who are looking for your services.
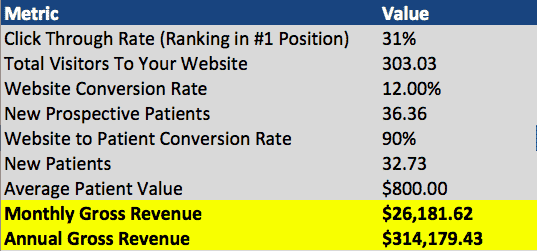
Now, back to our analysis. If 31.24% of traffic goes to the #1 ranking position, we can assume that with a total available search volume of 970, we can get around 303 new website visitors each month, which leads to our next section.
Step 3: Website Conversion Rate
In a perfect world, every website visitor would become a patient. However, that’s simply not the case. Sometimes patients choose another practice over yours for any variety of reasons, including but not limited to location, reputation, services provided (or not provided) and many other factors.
The way we measure this is the website conversion rate, or in simple terms, the number of people who contact you through your website (whether by phone, email, or contact form) divided by the total number of website visitors.
An average website will convert between 8-10% while an above average website or landing page will convert at 10-15%. For this example, we will use a slightly above average conversion rate of 12% since our keywords are targeted.
So, of the 303 website visitors our #1 ranking website receives, about 36 of them contact us to become a patient.
Step 4: Website to Patient Conversion Rate
Not every contact inquiry will become a patient due to some of the factors above, but also because of other variables (e.g., their insurance may not be accepted). When we assume that a practice that is in network will convert about 90% of contacts into patients, we are left with 32 NEW patients for our practice every month.
Step 5: Average Patient Value
This is where the rubber meets the road and we are able to quantify the value of a ranking #1. When we take the 32 NEW patients we received from our website in one month and multiply it by our average patient value, which for orthopedic issues is $800 on average, we predict Gross Monthly Revenue of $26,181.62 and Gross Annual Revenue of $314,179.43.
So What is a #1 Ranking in Google Really Worth?
Remember in the beginning of the article when I said to keep the $6,686.40 cost of buying the traffic from Google in mind? Even if you bought all of the available traffic from Google, you would still be making a 291% ROI on your monthly spend. However, since Adwords get significantly lower CTR than Google, it’s not possible to capture the same amount of traffic, let alone ALL of it.
The good news is organic traffic (even though it doesn’t scale as quickly as Google Adwords PPC) has a much higher return because once you are ranking #1, you don’t have to pay for the traffic on a per-click basis like you would with Adwords.
To put it in perspective, if you invested $5,500 per month in Search Engine Optimization services to rank your site #1 for these keywords, your monthly ROI would be 376%, meaning for every $1 you invest, you make $4.76 back.
That, right there, is the value of a #1 ranking in Google.
Now, if I had a machine that gave me $4.76 back for every $1 I put in, I would put in as many $1 bills as I could.
Wouldn’t you?